

Is This Working? Data-Driven Strategies to Reduce SNAP Payment Error Rates
By Anthony Lollo (Yale SCALE Lab), Eric Giannella (Georgetown University Better Government Lab), Ginger Zielinskie (Center for Civic Futures & Yale SCALE Lab), Maria Reyes-Gaskin (U.S. Digital Response), Sarah Esty (Aspen Institute Financial Security Program)
With the passage of the One Big Beautiful Bill Act (OBBBA), many states are now responsible for covering a portion of SNAP benefit costs, tied to the state’s SNAP payment error rate (PER). Based on historical SNAP PERs, states will collectively face an additional $10B annually in SNAP benefit costs beginning in October 2027. The severe budget implications of these penalties could have harmful and lasting effects on the ability of states to administer SNAP. But this is not set in stone. States can act to reduce their SNAP PERs but must move quickly for their efforts to impact their share of program costs in 2027.
States have concrete opportunities to use data, evidence, and rapid cycle analytics to identify and prioritize the sources of SNAP payment errors, remediating errors before they go out the door and preventing errors upstream at the root cause. States already have internal error detection built into processing through supervisor and/or quality assurance (QA) review. But states can make this step more effective by using historical data to develop predictive models on which cases are most likely to have errors, then using those models to prioritize which files go to supervisor or QA review. Given that states have limited resources for case review (so can thoroughly review only a fraction of all cases), and that review adds a step and slows down processing (so reviewing all cases thoroughly wouldn’t be a good idea even if there were resources to do so), analytics-driven prioritization of QA can maximize the effectiveness of this step.
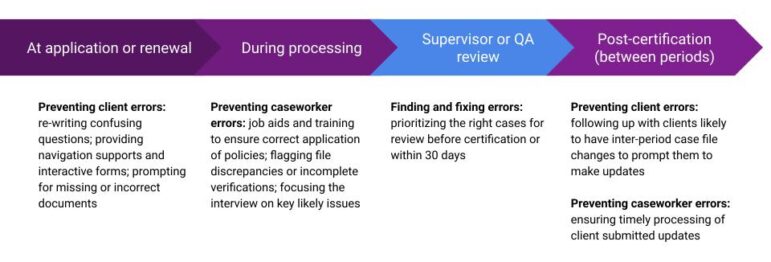
Effective use of historical data can also identify patterns in errors that states can use to improve their processes, communications, training, and navigation supports, preventing errors before they occur. This prevention work should operate across the full journey of a case, addressing issues at application, processing, post-certification, and renewal, and address both client- and caseworker-generated issues.
Good models can help states prioritize the most significant error types (such as a caseworker’s failure to reconcile conflicting income documents vs. a client’s failure to report a new job that substantially increases their income). Then, design research with the caseworkers and clients can help identify potential solutions (like an AI-generated flag that draws caseworkers’ attention to document conflicts or a mid-period text reminder to clients with a history of frequent job changes encouraging them to report any new jobs or increases in income). As they roll out these changes, states should deploy a rapid cycle test-and-learn approach to measure the impact of the new approaches and avoid unintended consequences.
Below, we outline how states can work with the data they have to:
- Focus on the right errors to reduce PER
- Maximize the impact of their QA operations to find and fix high-impact errors
- Track proxies and leading indicators
- Measure the effectiveness of process improvements to refine the approaches
Focus on the right errors to reduce PER
Not all errors are created equal. The Payment Error Rate is only concerned with errors outside of the tolerance threshold ($58 in FY26) or wholly ineligible cases, so fixing small errors is generally less useful. States seeking to find and reduce errors driving PER should specifically focus on errors that are greater than the threshold error. This focus applies to picking which cases to use to train a predictive model, and in any performance management approaches, such as counting which errors a QA team caught and fixed.
If states spend substantial time making minor corrections to benefit allotments this could result in many fixed errors with little impact on PER. For example, one cause of payment errors could be that a case’s SSI income was not updated to reflect annual cost of living adjustments. However, given these adjustments are minor, corrected benefits would only change by $10-20 from this error—an amount which wouldn’t have counted toward PER in the first place. Prioritizing the errors leading to the largest discrepancies in allotted benefits ensures effort is being spent fixing the errors that matter for the SNAP PER.
Maximize QA to find and fix high-impact errors
States have significant flexibility in how they manage QA (which may also include more informal reviews like supervisors’ double-checks of their teams’ case files), which can be optimized for the right balance of effectiveness at fixing material errors, resources devoted to QA, and reduction in case processing timeliness due to additional reviews.
- Prioritization of Cases: States vary widely in how they select which cases go to QA: random sampling (to proxy the real PER, but not prioritize fixing errors), threshold-based flags (picking all cases with certain features, like maximum benefit amount, more than 4 household members, or where expenses exceed income), or risk-scoring (where the holistic case information is used to predict overall likelihood of error). We recommend adopting a risk-scoring based approach using statistical or machine learning models trained on historical data. If full risk scoring is not possible, we recommend using a threshold-based approach with a best estimate about cutoffs using available data.
- Timing: QA often operates just prior to (re-)certification, as a last step before the benefit determination. However, if states are facing a QA backlog that is impacting timeliness, some states have chosen to conduct rapid post-certification QA, doing their reviews and corrections within 30 days after a determination.
- Thoroughness vs. breadth of review: Some states conduct a full desk audit of case files during QA, reviewing all elements carefully; other states focus their reviews solely on a few highest-risk elements, such as earned and unearned income and shelter deduction. Given capacity constraints, states should focus QA on the issues that are easiest to find and fix. For instance, if states catch more errors with an intensive full case review (as opposed to a targeted review of just income) but are able to review fewer cases overall, then this approach may be less effective on an “errors fixed per QA hour” basis. In general, we recommend a broader and shallower QA process, using a data-driven approach to decide which fields to review. A more sophisticated predictive model may be able to highlight which fields QA staff should look at on a specific case, while a simpler model may highlight which elements to look at for all cases, based on general patterns. Overall, we recommend being as targeted as possible with case reviews in order to maximize the yield of QA time.
Track proxies and leading indicators
As states are rolling out new QA processes or upstream interventions, they need to know whether those changes are working. However, Payment Error Rate has significant limitations as a day-to-day metric. PER is calculated from a small sample of cases, usually with a 2-3 month delay. That makes it hard to tell in real time whether a specific change is working. States implementing payment accuracy improvements need faster feedback. Here are four types of metrics that can fill the gap:
- Error reduction metrics track whether you’re catching and preventing errors at their source. If states are creating or expanding QA reviews of cases, prioritizing change report processing, or asking caseworkers to double-check high-risk case elements before determination, these metrics show whether it’s working. They should track QC-reported errors by source (change reports, specific income types), errors caught through pre-determination review, and the percentage of QA reviews that find errors above the threshold. At a minimum, tracking the percentage of cases pulled into QA without no errors and seeing a decline can help ensure the state’s criteria is balancing workload and actionable cases.
- Specific metrics could include:
- QC-reported errors (citing periodic reports, change reports)
- Errors and error dollars found by QA or pre-QA reviews
- Error dollars or frequency of errors tied to specific error types identified as key error drivers (for example, those related to income, verifications, or arithmetic and computation)
- Specific metrics could include:
- Processing efficiency metrics show whether workflow changes are reducing the conditions that lead to errors. If your state has created a team dedicated to change reports, improved case-based processing, or streamlined how clients report changes, these metrics reveal whether backlogs are shrinking. Growing backlogs signal growing risks with respect to errors and timeliness.
- Specific metrics could include:
- Time spent sitting in queue (for periodic reporting, change reports, preauthorization reviews, and general cases)
- Average case processing time
- Processing time for client-reported changes or change reports
- Cases processed untimely
- Average queue tasks/cases per worker
- Specific metrics could include:
- Workload management metrics help ensure quality improvements don’t create unsustainable bottlenecks. If you’re reorganizing task queues, moving QA review to pre-determination, or reducing unnecessary case touches, you should track pending case volumes, tasks completed per worker, and time spent sorting through queues. The goal is improving accuracy without increasing worker burden in the long term.
- Specific metrics could include:
- Average number of pending periodic reporting and change reports
- Average pending cases
- Percentage of PreAuth reviews that find an error over the threshold
- Specific metrics could include:
- Staff and client outcome metrics capture whether accuracy gains are sustainable, without burning out workers or burdening clients. Accuracy gains that erode worker morale or increase beneficiary burden aren’t durable. On the other hand, if your state is running quality retrospectives, improving feedback loops from QA/QC to frontline staff, or improving worker companion tools like job aides, reductions in errors can even show improvements in client and staff satisfaction.
- Specific metrics could include:
- Caseworker job satisfaction, trust, and retention
- Client requests for additional information
- Procedural denials, including missed interviews and missing verifications
- Specific metrics could include:
These operational metrics won’t replace PER, but they provide the real-time feedback that states need to refine interventions before annual results arrive.
Measure process improvements to refine approaches
In tracking the metrics above to see if interventions are working well, states will need to be able to make comparisons—either to a pre-intervention baseline, or to a control group, and tweak the intervention approaches based on real-time feedback on how things are going. These “test and learn” methods include:
Randomize the intervention or process change: Randomizing which staff or cases are subject to the change will provide the strongest evidence for the effectiveness of that change. Randomization is also a useful tool to promote equity and fairness when capacity is constrained and the intervention cannot reach every case. Although randomization is the gold standard for academic research, it doesn’t have to be run at a giant scale for a long time to produce statistically rigorous and practical results; even a short test of 1-2 weeks might be enough to show if an intervention is working well enough to roll out to the full caseload.
- For example, a team could split cases into even and odd case numbers and apply the status quo QA prioritization process to the even cases and a new prioritization process to the odd cases, then compare which method finds the largest amount of errors.
Stagger implementation of intervention or process change: Randomization is not always feasible. Staggering the roll-out of changes provides an evaluation alternative to randomization that offers teams the chance to understand whether or not the intervention is effective. It also allows for testing and refining an approach before scaling. And many implementations are already phased rollouts due to the need to train staff or bring new tools online, so there are built-in opportunities to measure results in places that went first.
- For example, different offices could implement a process at different times, with all offices eventually adopting that process. Over the roll-out period, comparisons between offices that have implemented the process with those that have yet to implement the process lets a state evaluate the effectiveness.
Measure change against a baseline: If a change has to be rolled out population-wide all at once, states can still measure the impact by collecting a pre-intervention baseline and measuring outcomes at specific intervals after the rollout to track the impact. If the changes are not working as expected, the state may need to roll back the change or revise it further.
Monitor PER improvements alongside other program and operational goals: Actions taken to reduce SNAP PER may have other system impacts, such as increasing denial rates or reducing timeliness. While undertaking PER reduction efforts, states will need to monitor multiple aspects of system functioning to provide a comprehensive view of the impact of interventions and identify if rebalancing across goals may be necessary. To achieve this more holistic system evaluation, states should consider:
- Program participation (total caseload trends)
- Program churn
- Case and procedural error rates (CAPER)
- Application processing timeliness (APT)
- Procedural denial rates
- Average time to process new applications and recertifications
- Worker caseload
The OBBBA has changed the financial stakes of SNAP payment accuracy. Although reducing PER is difficult, especially with limited staffing and financial resources, states can nonetheless make progress by focusing limited capacity on the errors that most influence PER, making their QA as effective as possible, tracking proxies to measure changes in close-to-real time, and rapidly iterating on improvement initiatives based on what the data shows. The timeline is tight, but the tools are in states’ hands. The key now is moving quickly, measuring consistently, and turning data into durable operational change.